Your Google score isn’t your real score. Google and Leading Courses rate the same 19 courses, and land 0.74 points apart, because one platform takes one tap and the other asks you to explain yourself.
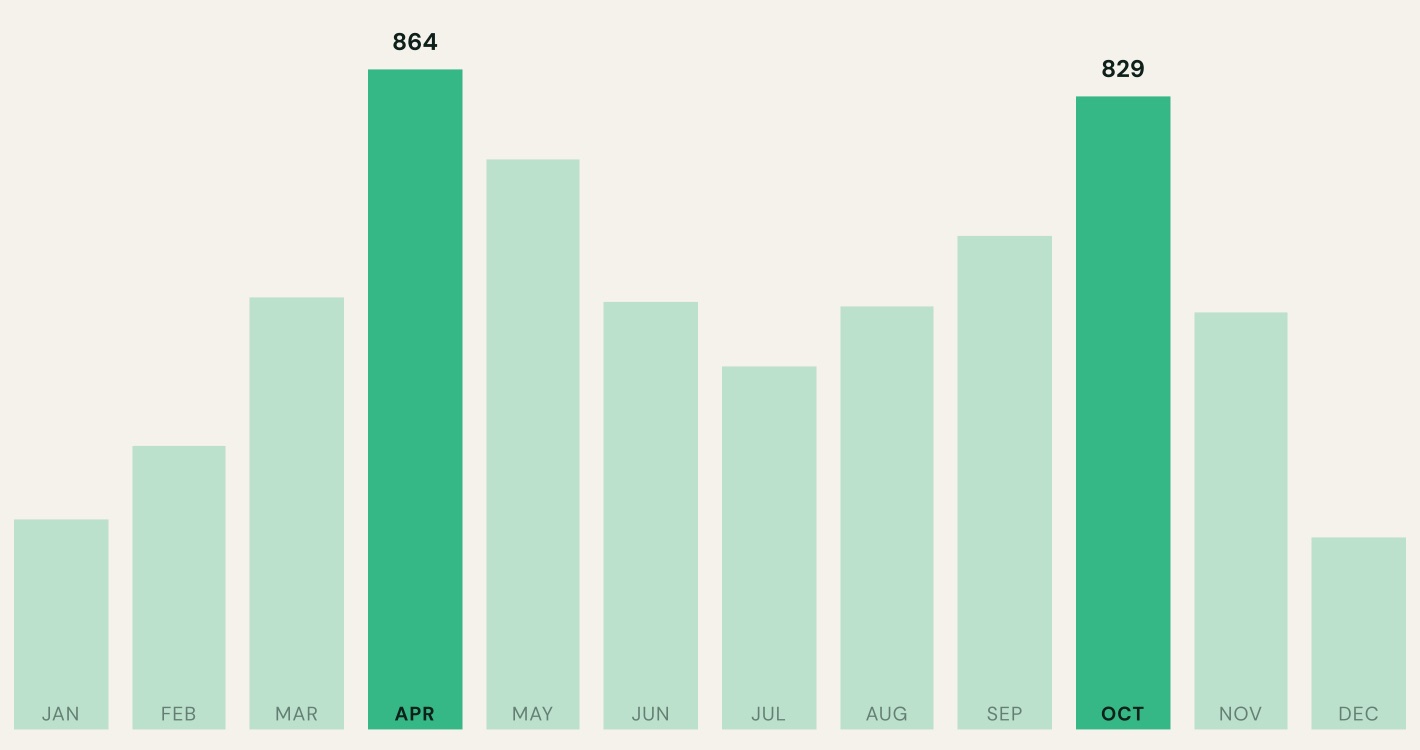
Based on when reviews were posted, not on tee-time data. We assume most golfers review shortly after playing: a reasonable proxy, not a measured one.
65.2% of Google reviews carry any text, against 100% on Leading Courses. On Leading Courses you score the club and the course separately, write at least 50 characters explaining why, and can add up to seven more ratings: maintenance, facilities, value, and others. On Google, one tap and you’re done.
67.3% of all Google reviews are five of five. Two thirds of every Google review sits in the top box. With most courses parked on the same rating, the scale stops separating one from another, and a small dip in an already crowded ceiling looks worse than it is.
6.5% of all Leading Courses reviews are a perfect ten. Barely one review in fifteen awards a perfect ten. The bulk clusters at 7 to 9, so the same course lands lower there than on Google: not because guests liked it less, but because the scale asks them to weigh it.
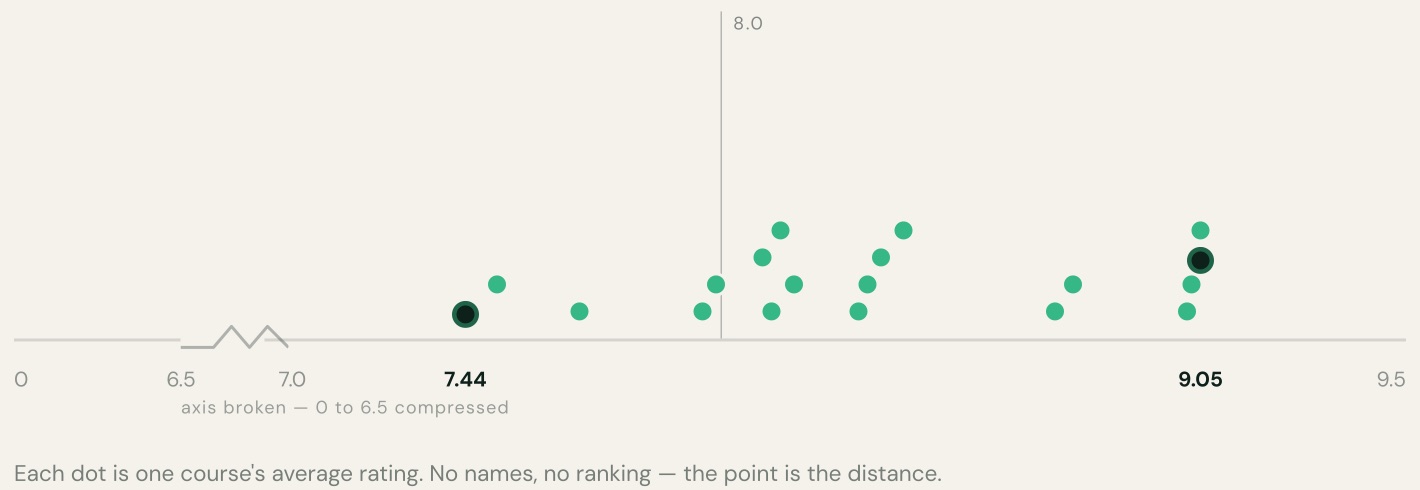
Between the lowest and highest average across the region: a gradual spread, not two outliers.
Review languages, as a share of reviews with a detected language:
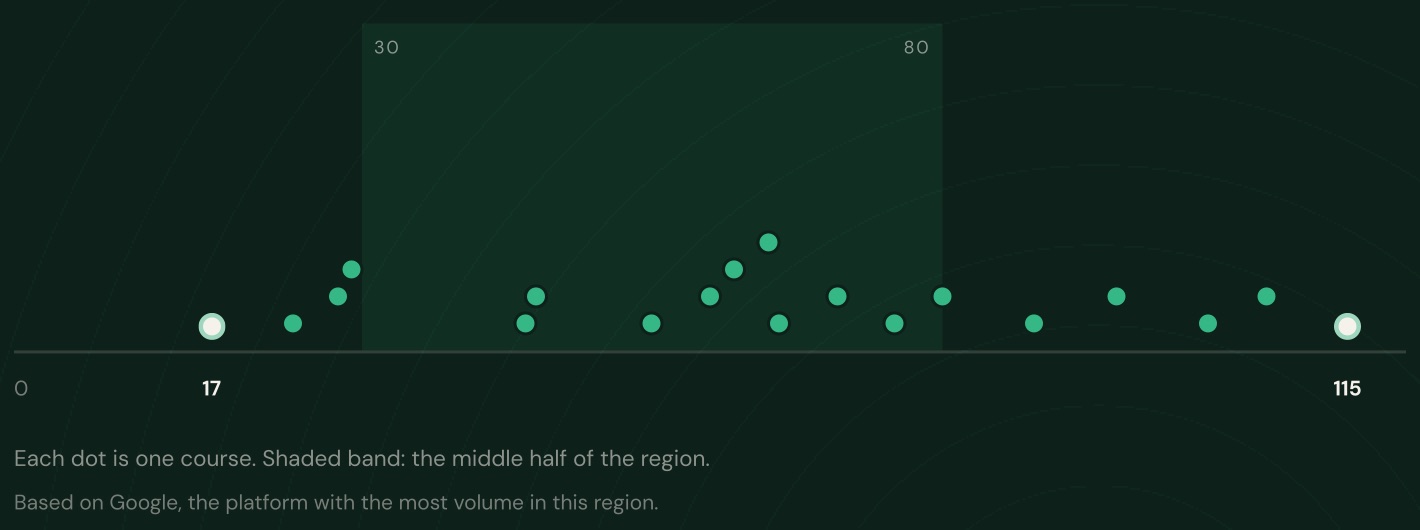
Two anonymised courses from the same region, same season, same platform, and opposite decisions about who gets an answer.
Every complaint has a decent chance of a reply. Every compliment is met with silence.
Praise and criticism both get an answer. The reply is part of the product, not a repair job.
Most courses on Mallorca sit somewhere between these two. The regional average hides the choice, and the choice is visible to every guest reading the page.
Zoom out from two courses to the region: destination-style resort courses answer 66.7% of reviews on average. Member-focused courses answer 24.0%. Both figures are region-wide averages across multiple courses, never a single club.
Reviews written in different languages don’t just read differently, they often arrive through different platforms, and the platforms themselves don’t measure the same way. That pattern alone explains part of the spread across languages.
But not all of it. French and Italian reviews arrive through nearly the same mix of platforms, yet the two languages still land almost two thirds of a point apart: a gap platform alone can’t explain.
Languages under 30 reviews regionwide are pooled, not shown individually. Every figure above is checked against a single course dominating the group before publication.
Every course measured on Google and Leading Courses, the two platforms with regionwide coverage.
Every course-level figure in this report is anonymised by design: no course is named, ranked, or identifiable from the numbers shown.
Every group figure is checked twice before it’s shown: is the group large enough to mean anything (fewer than three courses, and we don’t publish it), and is it carried by a single course? If one course accounts for more than 40% of a group’s reviews, we withhold the blended figure and show only the per-course average instead. A group average should describe a group, not one course wearing the group’s colours.
Where a platform records zero replies across the entire region, we treat that as a property of the platform or the data sync, not of the courses, and we exclude it from every response-rate figure rather than count it as silence.
This is the first edition of a recurring series. Later editions will be able to show trends over time as more full-coverage history accumulates.
ReputAI measures your club the same way, every quarter, against peers of the same type and tier. The next edition of The Reputation Files covers a new region; the place is being chosen now.